
Here’s the news, listings, open houses, events and more! Reach out if you have any specific questions! Enjoy!
Phoenix-Area Real Estate News
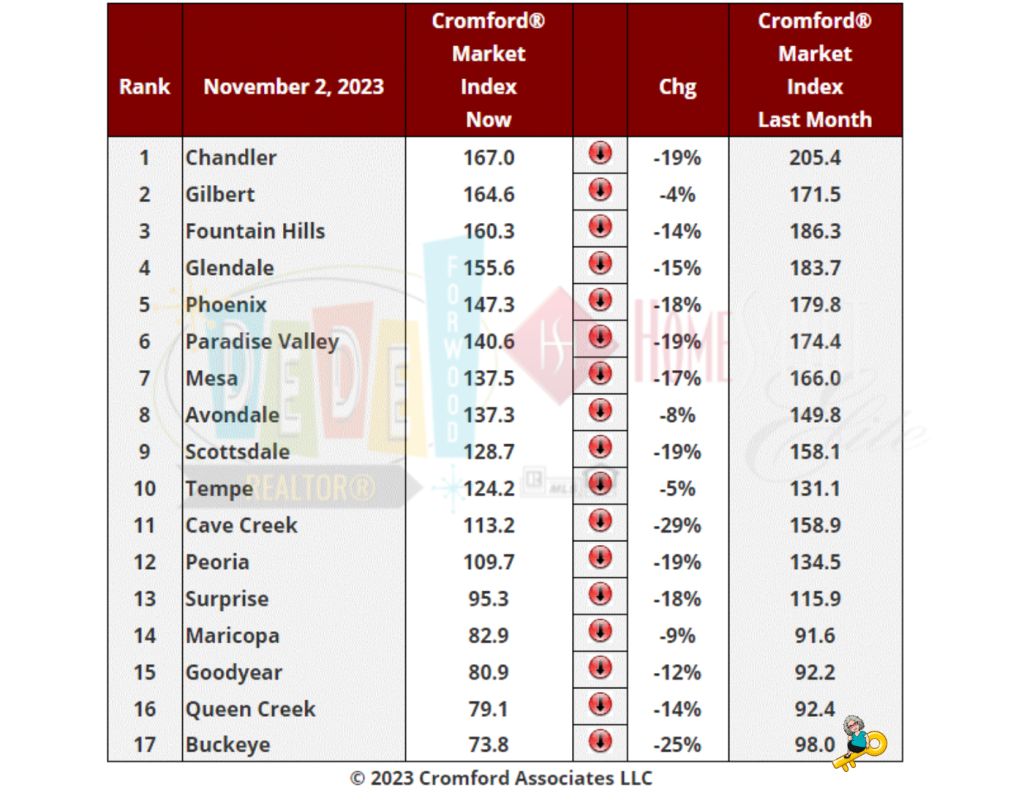
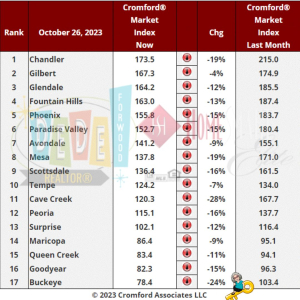
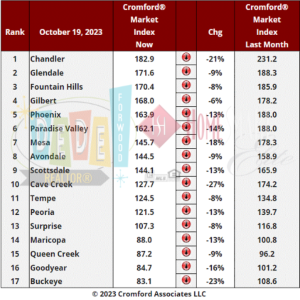
Cromford Market Index
The market is still weakening and at a faster rate, with an average decline of 15.6% in the Cromford® Market Index for the 17 cities above. This is worse than the 14.5% decline we saw last week.
Well above average declines in CMI can be seen in Cave Creek, Buckeye, Scottsdale, Paradise Valley, Chandler, Peoria , Surprise, Phoenix and Mesa. Falling but at a lower speed are Gilbert, Avondale, Maricopa and Tempe.
11 out of 17 cities are still sellers markets with Peoria and Surprise in the balanced zone while Buckeye, Goodyear, Queen Creek and Maricopa are all buyers’ markets. Queen Creek has joined Buckeye below the 80 level. Among the secondary cities, Casa Grande is also below 80 while Gold Canyon and Litchfield Park are below 90.
Tolleson, Laveen, Anthem, El Mirage and Apache Junction are the strongest of the secondary cities with CMIs over 190.
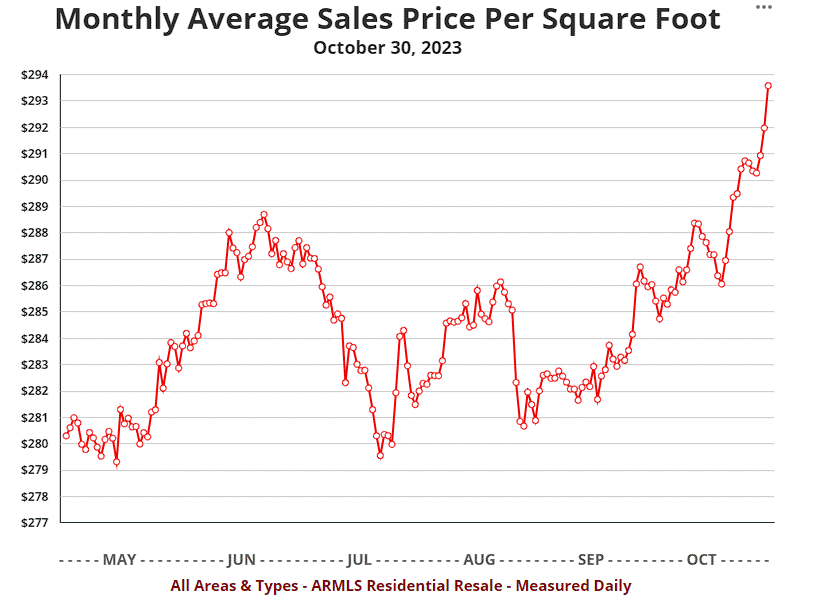
Monthly Average Sales Price Per Square Foot
Although the market is weakening quickly, you couldn’t tell from the closed listing prices we are recording:
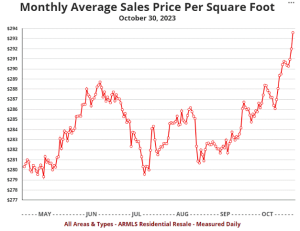
Breaking through the $293 level for the first time since July 12, 2022, this chart gives us the impression of a market in robust health.
This underlines the fact that sales pricing, even when measured every day, is very much a trailing indicator. Many of these prices were established in contracts agreed a few months ago when the Cromford® Market Index was still over 160, representing a strong seller’s market with declining inventory. Sales volumes have also held up better in the luxury market than at the opposite end of the market, where first time buyers are having difficulty affording a mortgage. This bias towards the higher end pushes the average $/SF upwards.
The leading indicators, such as the CMI, contract ratio, days of inventory and listing success rate are all reflecting the recent step down in demand and the rapid rise in active listings. This situation also shows us how poor the S&P / Case-Shiller® Home Price Index is in representing the current state of the market. Not only is the index a trailing indicator, it is 2 to 3 months behind the chart above because it uses a 3-month average for sales that closed between 2 and 5 months ago.
Active Listings
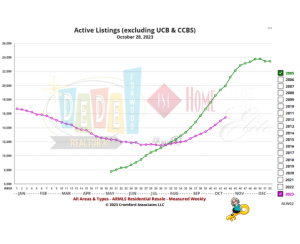
Active listing counts are rising at the second fastest rate we have ever witnessed for late October. Since the low point of 11,473 (excluding UCB and CCBS) in late July they have climbed almost 35% and are rapidly approaching 16,000. The only year which saw a faster rate was 2005:
Affidavit of Value
The Affidavit of Value recorded during October by Maricopa County have now been analyzed and show us the following:
- There were 5,543 closed transactions, down 8% from 6,019 in October 2022 and down 6% from September.
- There were 1,480 closed new homes, up 5% from 1,410 in October 2022 but down 9% from September.
- There were 4,063 closed re-sale transactions, down 12% from 4,609 in October 2022 and down 5% from September.
- The overall median sales price in October was $470,000, unchanged from October 2022 and up 4.4% from September.
- The re-sale median sales price was $445,000, down 0.6% from October 2022 but up 1.1% from September.
- The new home median sales price was $538,422, up 1.8% from October 2022 and up 12% from September.
New home sales have remained resilient and grew year over year, despite the extremely weak demand in the re-sale market.
Unlike the last 2 months, the new home numbers were not impacted by large buy-to-rent transactions with low unit prices. Consequently the new home median sales price jumped to $538,422, the highest we have ever recorded. These numbers are for single family and townhouse / condo homes.
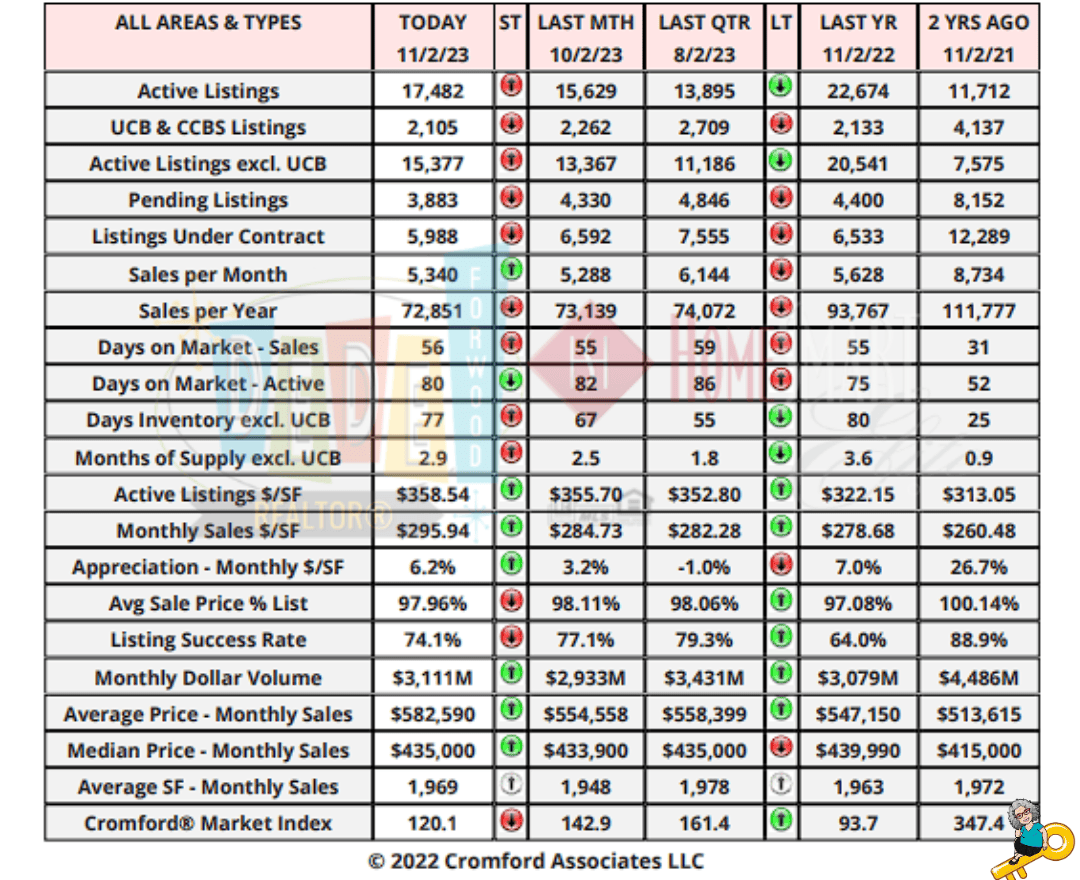
Concise Market Snapshot
Monthly Average Sales Price Per Square Foot
We can see that Phoenix pricing has been much weaker than the national average between 3Q 2022 and 3Q 2023. Although the market is weakening quickly, you couldn’t tell from the closed listing prices we are recording:
Breaking through the $293 level for the first time since July 12, 2022, this chart gives us the impression of a market in robust health.
This underlines the fact that sales pricing, even when measured every day, is very much a trailing indicator. Many of these prices were established in contracts agreed a few months ago when the Cromford® Market Index was still over 160, representing a strong seller’s market with declining inventory. Sales volumes have also held up better in the luxury market than at the opposite end of the market, where first time buyers are having difficulty affording a mortgage. This bias towards the higher end pushes the average $/SF upwards.
The leading indicators, such as the CMI, contract ratio, days of inventory and listing success rate are all reflecting the recent step down in demand and the rapid rise in active listings.
This situation also shows us how poor the S&P / Case-Shiller® Home Price Index is in representing the current state of the market. Not only is the index a trailing indicator, it is 2 to 3 months behind the chart above because it uses a 3-month average for sales that closed between 2 and 5 months ago.
Cromford Market Index
Here is our latest table of Cromford® Market Index values for the single-family markets in the 17 largest cities
The market is weakening at a faster rate, with an average decline of 14.5% in the Cromford® Market Index for the 17 cities above. This is worse than the 13.4% decline we saw last week.
Well above average declines in CMI can be seen in Cave Creek, Buckeye, Chandler and Mesa. Falling but at a lower speed are Gilbert, Avondale, Maricopa and Tempe.
12 out of 17 cities are still sellers markets with Surprise in the balanced zone while Buckeye, Goodyear, Queen Creek and Maricopa are all buyers’ markets. Buckeye has even slipped below the 80 level.
Average List Pirce per Sq Ft
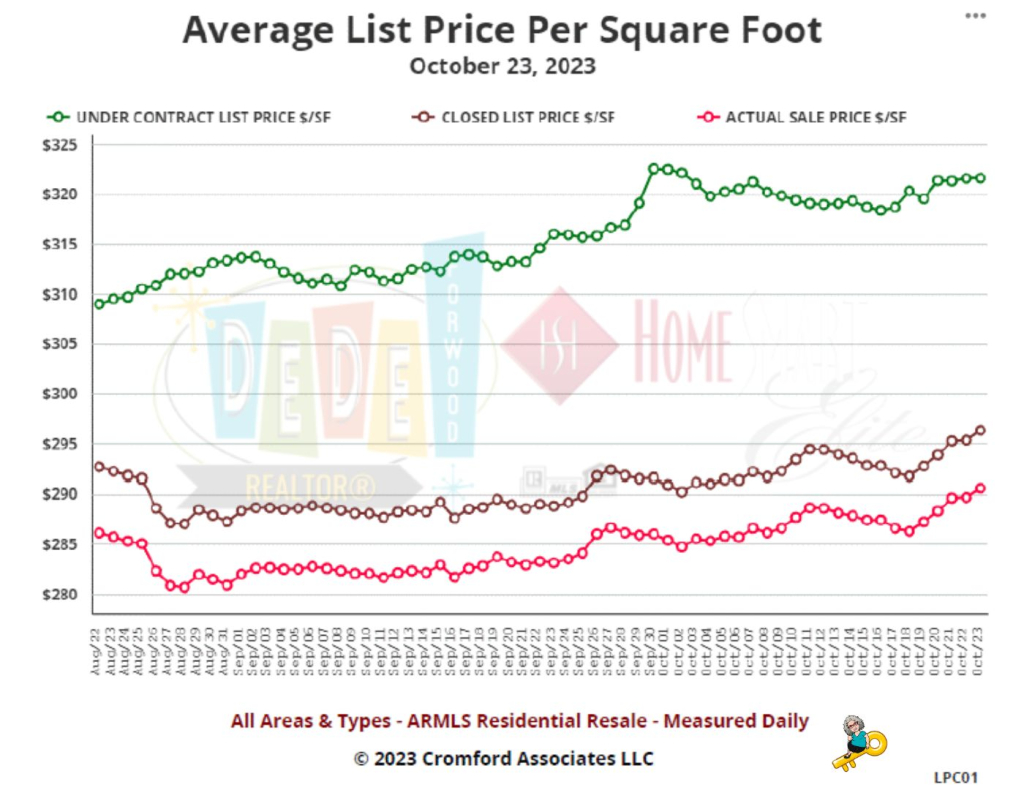
The monthly average sales price per sq. ft. has just breached $290 to the upside, while the average $/SF for listings under contract remains comfortably above $320.
As we see inventory rise we also see more sellers cutting their asking price, but this has not filtered through to the chart.
Concise Market Snapshot
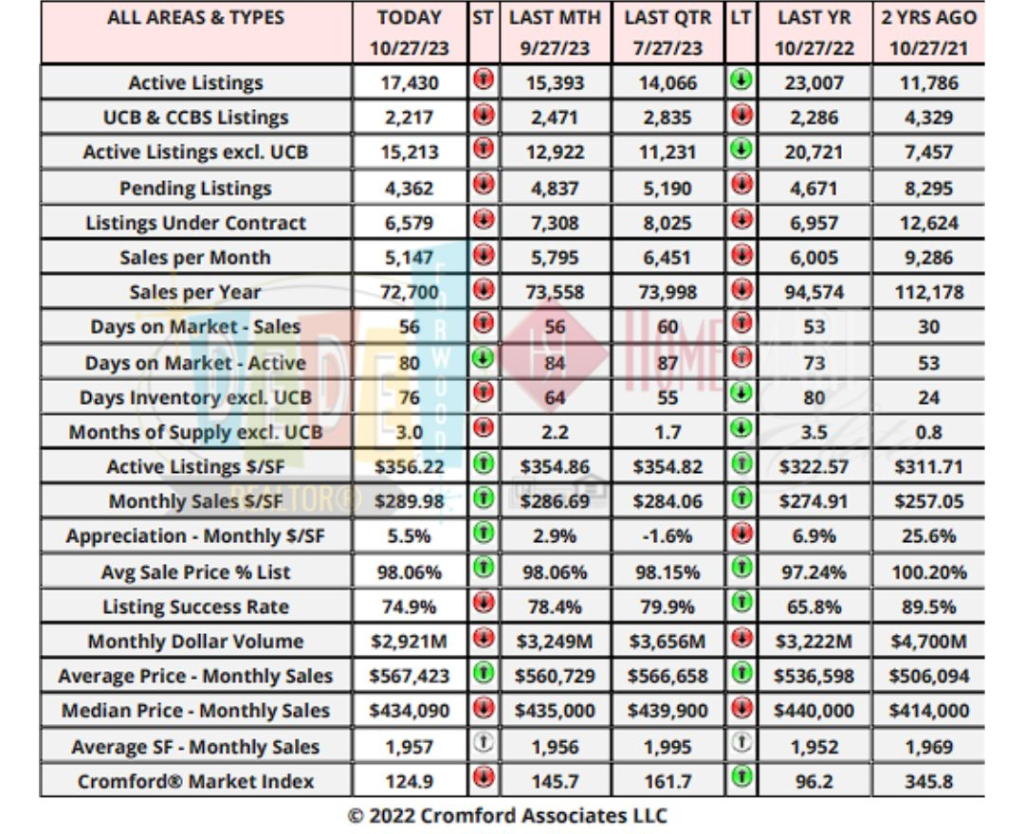
The table provides a concise statistical summary of today’s residential resale market in the Phoenix metropolitan area.
The figures shown are for the entire Arizona Regional area as defined by ARMLS. All residential resale transactions recorded by ARMLS are included. Geographically, this includes Maricopa county, the majority of Pinal county and a small part of Yavapai county. In addition, “out of area” listings recorded in ARMLS are included, although these constitute a very small percentage (typically less than 1%) of total sales and have very little effect on the statistics.
All dwelling types are included. For-sale-by-owner, auctions and other non-MLS transactions are not included. Land, commercial units, and multiple dwelling units are also excluded.
On Friday, November 03, 2023, the current average 30-year fixed mortgage interest rate is 7.94%, decreasing 10 basis points from a week ago. If you’re planning to refinance, today’s average interest rate for a 30-year fixed refinance is 8.05%, decreasing 13 basis points over the last seven days. Meanwhile, the current average 15-year fixed refinance interest rate is 7.41%, down 3 basis points since the same time last week.
New Listings:
Upcoming Open Houses:
Don’t forget to bring me!
Recent Price Changes:
Featured Listings:
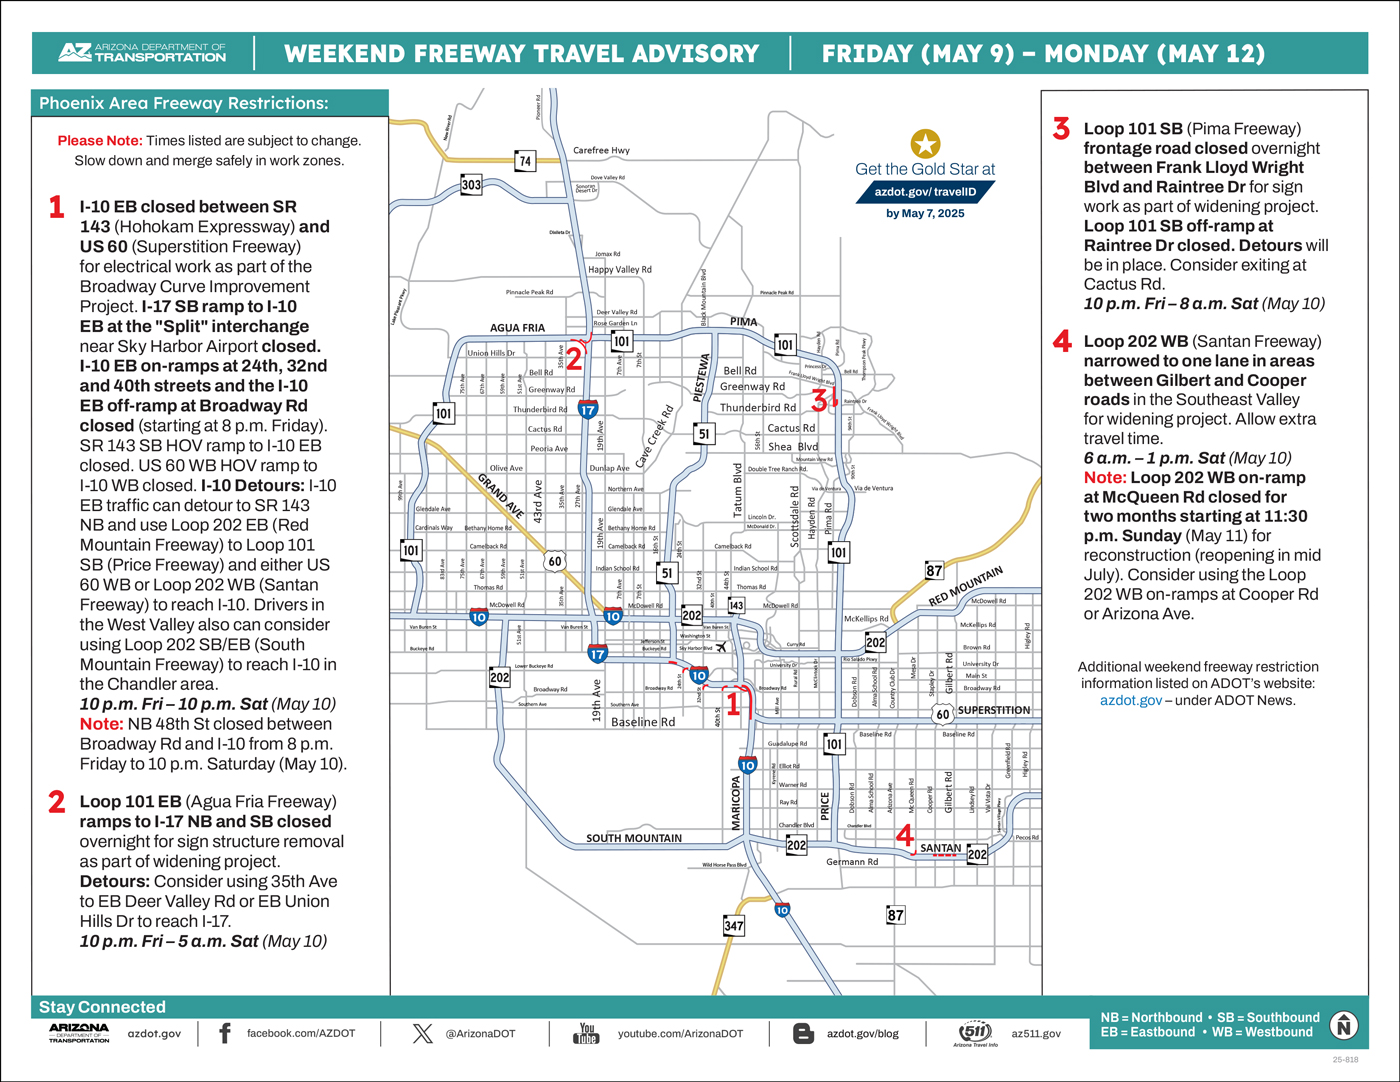
ADOT’s Weekend Freeway Travel Advisory (Nov. 3-6) – Phoenix Area
I-17 closed in north Phoenix, eastbound I-10 closed near downtown
PHOENIX – Stretches of Interstate 10 and Interstate 17 in Phoenix will be closed this weekend (Nov. 3-6) for separate improvement projects managed by the Arizona Department of Transportation, Arizona Public Service Co. (APS) and Valley Metro. Drivers, including those traveling to NASCAR events in the West Valley, should consider using alternate routes if necessary while the following weekend closures are in place:
- Southbound I-17 closed between Loop 101 and Bell Road in north Phoenix from 10 p.m. Friday to 5 a.m. Monday (Nov. 6) for APS powerline work. Southbound I-17 on-ramp at Rose Garden Lane and both Loop 101 ramps to southbound I-17 closed. Expect delays and allow extra travel time.
- Detours: Drivers can consider using eastbound Loop 101 to southbound SR 51 as an alternate freeway route to the downtown Phoenix/Sky Harbor Airport area. Local detour routes include exiting ahead of the closure and using southbound 19th or 35th avenues to travel beyond closure.
- Special Traffic Alert: If you normally would use I-17 in north Phoenix to travel toward NASCAR events in the West Valley, consider other routes including westbound/southbound Loop 303 to I-10. Allow extra travel time, especially along southbound I-17 approaching Loop 101.
- Northbound I-17 closed between Dunlap Avenue and Union Hills Drive from 10 p.m. Friday to 5 a.m. Monday (Nov. 6) for APS powerline work and Valley Metro’s light rail bridge project. Northbound I-17 on-ramps at Bethany Home Road, Glendale Avenue and Northern Avenue closed.
- Detours: Drivers can consider using northbound SR 51 to westbound Loop 101 as an alternate freeway route to travel beyond closure. Local detour routes include exiting ahead of the closure and using northbound 19th or 35th avenues to travel beyond closure.
- Please Note: Eastbound I-10 is closed this weekend between the I-17 “Stack” interchange and Seventh Street near downtown Phoenix.
- Eastbound I-10 closed between the I-17 “Stack” interchange (near 35th Avenue) and Seventh Street from 10 p.m. Friday to 10 a.m. Sunday (Nov. 5) for bridge inspections and tunnel maintenance. Both I-17 ramps to eastbound I-10 closed.
- Detours: Eastbound I-10 traffic can detour to southbound I-17 and connect with I-10 at the “Split” interchange near Sky Harbor Airport.
- Priest Drive closed in both directions overnight at US 60 (Superstition Freeway) from 8 p.m. Friday to 4 a.m. Saturday (Nov. 4) for construction.
- Detour: Consider alternate routes including Mill Avenue.
Schedules are subject to change due to inclement weather or other factors. ADOT plans and constructs new freeways, additional lanes and other improvements in the Phoenix area as part of the Regional Transportation Plan for the Maricopa County region. Most projects are funded in part by Proposition 400, a dedicated sales tax approved by Maricopa County voters in 2004.
Real-time highway conditions are available on ADOT’s Arizona Traveler Information site at az511.gov and by calling 511. Information about highway conditions also is available through ADOT’s Twitter feed, @ArizonaDOT.
Valley of the Sun Sold Listings
D-22J-23J-23J-23F-23A-23A-23S-23O-234,0009,0005,0006,0007,0008,000
Number of Sold Listings
Information is deemed to be reliable, but is not guaranteed. © 2023
Valley of the Sun Inventory
D-22J-23J-23J-23F-23A-23A-23S-2305,00025,00010,00015,00020,000
Number of Active ListingsNumber of New Listings
Information is deemed to be reliable, but is not guaranteed. © 2023
Valley of the Sun New Listings
D-22J-23J-23J-23F-23A-23A-23S-23O-234,0009,0005,0006,0007,0008,000
Number of New Listings
Information is deemed to be reliable, but is not guaranteed. © 2023
Valley of the Sun Pending Listings
D-22J-23J-23J-23F-23A-23A-23S-23O-233,0008,0004,0005,0006,0007,000
Number of Pended Listings
Information is deemed to be reliable, but is not guaranteed. © 2023
Valley of the Sun Absorption Rate
D-22J-23J-23J-23F-23M-23A-23A-23S-23O-23232.22.42.62.8
Absorption Rate (in Months)
Information is deemed to be reliable, but is not guaranteed. © 2023
Valley of the Sun Sale to Original List Price Ratio
D-22J-23J-23J-23F-23M-23A-23A-23S-23O-2391979293949596
Sale to Original List Price (Percentage)
Information is deemed to be reliable, but is not guaranteed. © 2023
Valley of the Sun Average Days on Market
D-22J-23J-23J-23F-23M-23A-23A-23S-23O-235085556065707580
Average CDOM (in Days)
Information is deemed to be reliable, but is not guaranteed. © 2023
Valley of the Sun New Listings Volume
D-22J-23F-23A-23A-23O-232,500,000,0006,000,000,0003,000,000,0003,500,000,0004,000,000,0004,500,000,0005,000,000,0005,500,000,000
New List Volume (in Dollars)
Information is deemed to be reliable, but is not guaranteed. © 2023
National Real Estate News
I’ll be honest, it’s been a real bummer sharing mostly discouraging news about the housing market over the past few weeks. While this week is not quite rainbows and cupcakes, there is good news to share for buyers (a big move down in mortgage rates) and sellers (home prices continue to rise). It’s Thanksgiving month, so let’s be grateful for small things too.
Case-Shiller Index makes it 7 in a row. The national home price index rose 0.9% MoM in August 2023, an acceleration from +0.7% in July 2023. Prices have already risen 4% year-to-date, and are 1.5% above their previous peak in mid-2022. More details on the individual city indices below. [S&P Global]
FHFA Index makes it 12 in a row. Home prices rose 0.6% MoM in August 2023, a deceleration from +0.8% in July 2023. Prices have risen 6% year-to-date, and are 4.7% above their previous peak in mid-2022.
Wondering why these two are always a bit different? Like Case-Shiller, the FHFA index tracks transaction pairs, the most accurate way to measure home price appreciation. But the FHFA index only looks at transactions financed with a conforming mortgage. So no all-cash transactions, and no jumbo loans.
That sinking feeling in Europe. Eurozone GDP contracted 0.1% in the 3rd quarter. The German, Irish and Austrian economies all went backwards, while France barely grew. “Headline” Eurozone inflation, meanwhile, fell more than expected to +2.9% YoY, and “core” inflation dropped from 4.5% to 4.2% YoY.
Still adding jobs, just slower. ADP’s monthly employment report showed that private employers added 113,000 jobs in September. For most of 2023, the 3-month average was >200,000. Wage growth slowed further, but remained elevated at +5.7% YoY for job stayers and 8.4% for job leavers. A year ago, those figures were +7.7% & +15.4%, respectively. [ADP]
What the Fed said. The Federal Reserve kept its policy rate steady at 525–550 basis points (5.25–5.50%) for the second-straight meeting. This, in and of itself, is ‘dovish,’ notwithstanding Chairman Powell’s usual rhetoric.
The bond market liked it. Even though pretty much everyone expected the Fed to do nothing, bond prices still rallied aggressively (pushing yields lower). How much of that was the weaker-than-expected ADP and ISM data versus Powell’s press conference we’ll never know, but average 30-year mortgage rates dove to 7.51%.
On the Case (Shiller)
The mass media tends to focus on Case-Shiller’s national price index. That’s understandable, but real estate is a local game, so let’s dive into the big city indexes:
- 10 of the 20 individual big city indices set new all-time highs. Chicago and New York are already 5% above their mid-2022 peaks. Cleveland is 4% above.
- San Diego prices are up 7.5% ytd! New York City is +6.1% ytd. None of the 20 big city indices are down ytd.
- Los Angeles, San Diego, and Tampa Bay are VERY CLOSE to setting new highs. It is highly likely that all three will hit new highs next month.
- San Francisco (-9.4%), Seattle (-7.3%), Las Vegas (-6.5%), and Phoenix (-6.1%) are still well below their mid-2022 peaks, but Seattle and Las Vegas are rebounding quickly.
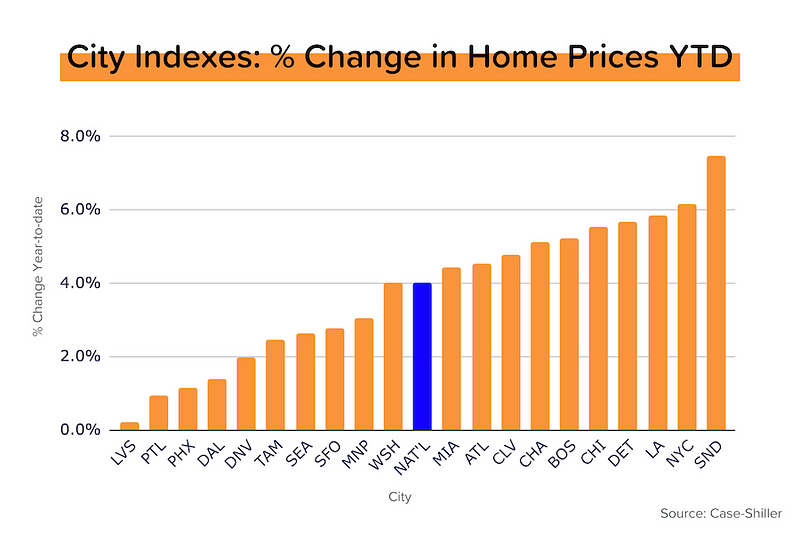
Reminder: We pay extra attention to the Case-Shiller index because it provides the most accurate measure of home price appreciation. By tracking large numbers of transaction pairs (e.g. House A sold in October 2017 at $300,000 and again in January 2024 at $550,000), the Case-Shiller index comes closest to measuring ‘true’ appreciation. Many of the other home price measures are skewed by the mix (high-end vs. low-end) of properties being sold during the period.
Biggest Builders Getting Bigger and Public-er (Sorry)
In 1989, the Top 10 builders represented just 9% of new home sales nationwide. In 2000, this had doubled to 19%. And by 2022, it had doubled again to an incredible 43% of unit sales! And the Top 20 represented 53% of all sales. The homebuilding industry is becoming increasingly concentrated.
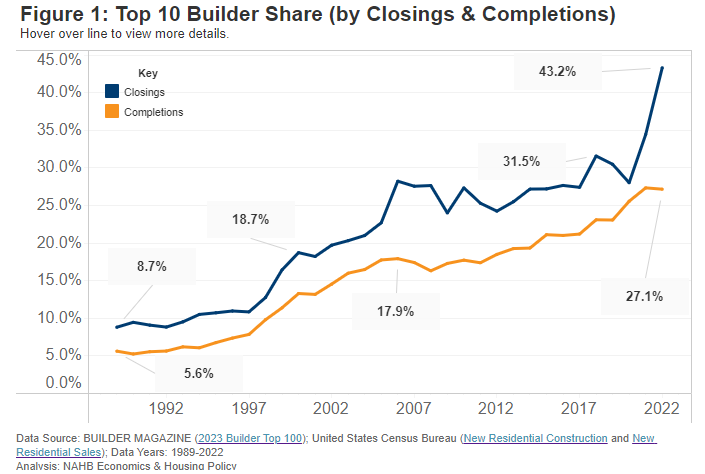
In 2022, nine of the Top 10 builders were publicly-listed. And 17 of the Top 20 builders were publicly-listed. In other words, most of these Top 20 builders have a share price that changes daily. They have to think about increasing shareholder value (getting the stock price up, paying dividends, or buying back shares.) And executive compensation is often tied to the share price in one of various ways. The homebuilding industry is increasingly public (listed.)
I’m not saying that going public is bad. But I analyze public companies and I know for sure that public companies behave differently than private companies. Public companies don’t build homes out of the goodness of their hearts. They build homes because they believe they’ll generate a solid margin and a strong return on invested capital.
In a way, we’re increasingly reliant on public companies (listed builders) to provide a public good (new homes to address the housing shortage.) Hmmmm. Want to check out new homes without being hounded? Browse here and if you want to go look at new builds, take me with you!
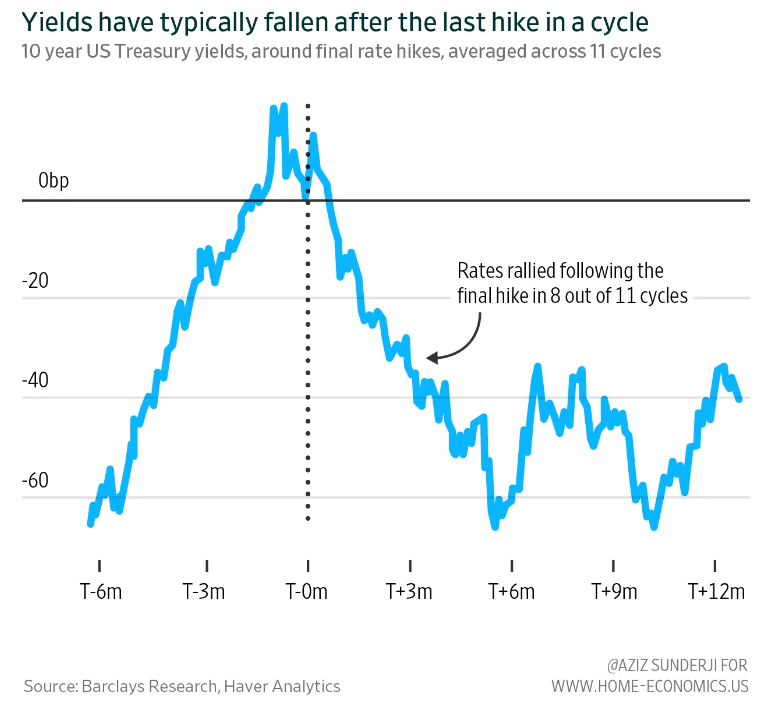
When the Fed stops
It’s possible that this time is different. But it usually isn’t. After an aggressive Fed tightening cycle, rates rarely stay ‘higher for longer,’ and the landings are scarcely ‘soft.’ And as a reminder, this has been a very aggressive Fed tightening cycle by historical standards.
The blue line in the graph below is the effective federal funds rate. The light gray bars indicate recessions. Do you see what I see?
- A sharp price in the fed funds rate almost always precedes (precipitates?) a recession.
- ‘Higher for longer’ is standard verbiage from the Fed, but just try to find it on the graph. (The closest is the plateau between 2007–2008.) ‘Overdid it and now regret it’ seems more common.
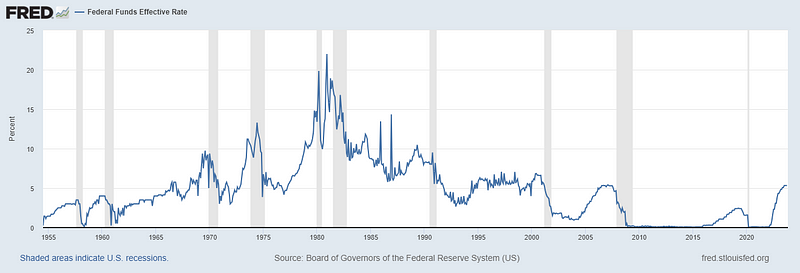
No matter what Federal Reserve Chairman Jerome Powell says, we’re nearing the end of this rate tightening cycle. And when the Fed stops, US treasury bond yields (and mortgage rates) usually have a big move lower. What we’ve seen over the past few days might well be part of that, as the market interprets the Fed’s double ‘skip’ as an unspoken ‘stop.’ [Thanks to my friend Aziz from Home Economics for the chart below.]
Mortgage Market
Bond movements have shaved more than half a percent off average mortgage rates in the past few days. Look, 7.5% is still a big number, but let’s just be happy that it’s lower than 8%.
The next FOMC (Federal Open Market Committee) meeting is on December 13. At the moment, the market is only putting a 15% probability on another +25 bps rate hike. In other words, the market is putting an 85% probability on a third-straight pause.
They Said It
“No single industry dominated hiring this month, and big post-pandemic pay increases seem to be behind us. In all, October’s numbers paint a well-rounded jobs picture. And while the labor market has slowed, it’s still enough to support strong consumer spending.”?—?Nela Richardson, ADP Chief Economist
“On a year-to-date basis, the National Composite has risen 5.8%, which is well above the median full calendar year increase in more than 35 years of data. The year’s increase in mortgage rates has surely suppressed housing demand, but after years of very low rates, it seems to have suppressed supply even more. Unless higher rates or other events lead to general economic weakness, the breadth and strength of this month’s report are consistent with an optimistic view of future results.”?—?Craig Lazzara, S&P Global Managing Director

My Website always has a list of what’s upcoming. Go here and maybe I’ll see you out there!


What’s Going on with DeDe?
This week, the kids got their first visit by Trick or treaters! They did great! For a while, then the trick or treating dogs and feral cats showed up. Then they watched from outside! 2600 pieces of candy given out at Casa De DeDe!

Darci stole a stuffed animal from me and adopted her new best friend! So funny to watch her drag this bear around that’s bigger than her!

Arizona Fall League is winding down! I’m getting to as many games as I can. Check the schedule and maybe I’ll see you out there! Go Glendale Desert Dogs!

That’s all for this week’s edition of the newsletter! Know I am always here for any questions you have about Buying, Selling, or Investing in Residential Real Estate! HomeOwnership too! Vendors and Tradespeople too! Don’t hesitate to Reach out
See you next Week!
DeDe

DeDe Forwood
My name is DeDe Forwood, I am a Phoenix Real Estate Agent with HomeSmart Elite Group. After 20 years in the entertainment industry as a Project Manager/ video engineer in major event operations...being on the road for so long, becoming a Phoenix REALTOR® seemed like the perfect fit for my experience, attention to detail, love of helping people, and my passion for Phoenix! My background in project management and event operations is actually an amazing fit with Phoenix real estate. I'm someone who is both organized AND passionate about all things buying and selling homes in Phoenix. My area of expertise is the Phoenix historic neighborhood districts, midtown, downtown and the central corridor, but I cover the entire Valley of the Sun! LISTING WITH ME, you get the passion of someone who is all about the digital age in real estate. With the tech-savvy experience of a digital marketer, I offer my clients the cutting edge of technology that changes constantly, attention to detail, professionalism, fairness, honesty, integrity, and enthusiasm. BUYING WITH ME as your Buyer's agent, you get every digital advantage to find listings quickly, the energy to go see them quickly. I've got the passion that only a customer service nerd can have, a love of all things real estate in Phoenix, the project management, and engineer's brain, and the tech-savvy-ness of a digital marketer. Let's get you HOME!! WHERE do you want to live...HOW do you want to live!
Hello, Happy Friday! Here's the news, listings, open houses, events and more! Reach out if you have any specific questions! Enjoy!
Phoenix-Area Real Estate News
All 17 cities have seen their CMI drop over the last month, meaning that power is quickly slipping away from sellers and moving towards buyers. The average CMI in the table has fallen by 13.4%, well above the 11.2% we measured two weeks ago.
Although almost all pundits predicted rates would fall in the second half of 2023, the typical 30-year fixed mortgage rate is now around 8.03%, up from 7.33 a month ago. In historical terms, this is unexceptional, but the majority of home-buyers are too young to have experienced rates at this level before. Unless they are working with a seller who is prepared to buy-down their interest rate, the majority of buyers lack enthusiasm to jump in at this point and many are choosing to wait until times get easier. People would still like to buy a home eventually, so latent demand is rising while actual demand falls.
Supply is now rising at the fastest rate so far this year. The combination of lower demand and higher supply is just what sellers don't want.
Well above average declines in CMI can be seen in Chandler, Cave Creek, Buckeye and Mesa. Falling but at a lower speed are Gilbert, Avondale, Glendale, Queen Creek, Fountain Hills, Tempe and Surprise.
12 out of 17 cities are still sellers markets with Surprise in the balanced zone while Buckeye, Goodyear, Queen Creek and Maricopa are all confirmed as buyers' markets.
Cromford Market Index
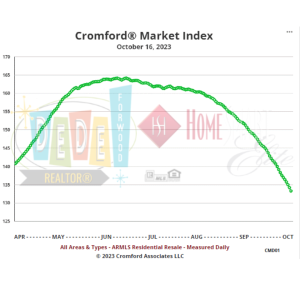
The Cromford® Market Index managed to stay above 160 until August 19, but since then it has declined at an accelerating rate in the face of increasingly unattractive mortgage interest rates.
The 30-year jumbo rate has already breached 8% and the 30-year fixed rate looks likely to follow, after jumping higher at the start of this week. Demand has been weak all year but these rates are driving it to lower levels. At 73.2 the Cromford® Demand Index is the lowest we have recorded since January 11 and is still trending down. In January the Cromford® Supply Index was also heading down fast, keeping the market balanced in favor of sellers. This month we are seeing supply increase, so balance is shifting in favor of buyers.
Although we are not in the balanced CMI range between 90 and 110 yet, the current trend would place us there within a matter of weeks. This is not a reassuring situation for sellers and their confidence is much weaker than it was a couple of months ago. Buyers have a better negotiating position but those needing finance are increasingly dismayed at the cost of their monthly repayment. Both sides are unhappy, leading to weakening transaction volumes and lower closing rates. This spreads the hurt across all sectors of the housing industry. New home builders are the least affected, since they have the financial resources to buy-down the interest rates for their customers and so maintain better sales volumes and pricing.
The listing success rate has declined to around 76% after staying over 80% until the end of July. The positive news is that it has not dropped to the level of this time last year, when we seeing success rates in the low 60s.
Concise Market Snapshot
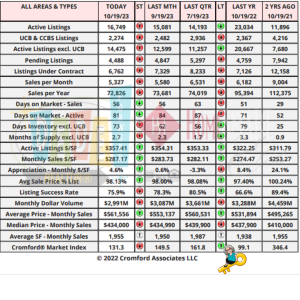 Our Concise Market Snapshot has the Valley of the Sun at 16,749 Active Listings, up 1,668 from this time last month and down 6,285 from this time last year. Under Contract listings are at 6,762, down from last month's 7,329 and last year's 7,126. Pending Listings are 4,488, down from last months 4,847 and from last year's 4,759. Sales per month are at 5,327, down from last month's 5,580 and last year's 6,182. Days on market sales are at 56, same as last month's and up from last year's 51. Days on marke - active are at 81, down from last month's 84 and up from last year's 71.
Active listings $/sf is $357.41, up from last month's $354.31 and last year's $322.25. Monthly Sales $/sf is at $287/17, up from last month's $283.73 and last year's $274.47. Monthly Appreciation is at 4.6%, up from last month's 0.6% and down from last year's 8.4%. Average sales price % of list price is 98.13%, up from last month's 98% and last year's 98.40% Our Average Price is $561,556, up from last month's $553,137 and last year's $531,893. Median price is $434,000, down from last month's $434,990 and up from last year's $437,900.
Average SQ Ft is 1,955, up from last month's 1,950 and last year's 1,938.
Exciting Big Building Projects transforming the Valley:

Big building projects are changing the landscape of the valley, bringing new opportunities for job growth, economic development, and potential homes. Here are some noteworthy projects to keep an eye on when figuring where to live AND How to live:
1. **Sheels, Chandler**: Opening in Fall 2023 at Chandler Fashion Center, Sheels is set to be a 20,000-square-foot marvel that will employ 400 people. The complex will feature a Ferris wheel, a saltwater aquarium, a wildlife mountain, a candy shop, a restaurant, café, arcade, and sports simulators. Additionally, specialty shops catering to fashion, outdoor sports, hunting and fishing gear, athletic clothing, and sports equipment will be available. It's a one-stop destination for shopping and entertainment!
2. **Mattel Adventure Park, Glendale**: Expected to open in 2024 near the Cardinals Stadium, the Mattel Adventure Park capitalizes on Barbie mania. You can watch the fascinating construction process via a construction cam or time-lapse. Glendale, the sixth-largest city in Arizona, is a bustling hub with significant establishments like Luke Air Force Base, Boeing, Lockheed-Martin, Magellan Aerospace, and Honeywell. For entertainment, you have State Farm Stadium, Gila River Arena, spring training fields, and abundant shopping and hospitality options.
3. **Ritz-Carlton Resort & Hotel, Paradise Valley**: The Ritz-Carlton Resort & Hotel project, initiated in 2018, is nearing completion. This 122-acre space in Scottsdale will house a 200-unit hotel, 81 resort villas, and approximately 120 single-family lots. The development also includes dining and entertainment options. Although job postings are not available online yet, this project is expected to bring a wave of employment opportunities to the area. Stay updated by checking the construction website.
4. **Kohler, Casa Grande**: The well-known kitchen and bath manufacturer, Kohler, is constructing a plant in Casa Grande. This endeavor is set to create 500 full-time jobs in their manufacturing facility, ancillary warehouse, and office space. Kohler's one million square-foot site is environmentally conscious, incorporating sustainability and alternative energy sources. The project is slated for completion in 2025, offering potential employment prospects and contributing to the local economy.
These exciting building projects not only enhance the Valley's infrastructure but also provide potential buyers with promising new areas to explore! Stay tuned for further updates as these projects develop and enrich the local community.
What DeDe is Reading:

I read an interesting Article from REALTOR.com recently and I'm definitely seeing an uptick in multigenerational living. I even saw it in the home my Sellers just sold! In the face of soaring home prices and rising mortgage rates, today's hopeful homebuyers are exploring innovative paths to homeownership. A recent survey conducted by Realtor.com and Censuswide reveals that many potential buyers are turning to their families for assistance. For over 700 respondents planning to purchase a home within the next year, financial challenges have led 29% to move in with their parents, while an additional 22% are considering this option. Younger respondents, in particular, are open to this strategy.
Moreover, 62% of respondents are willing to downsize or relocate to a less desirable neighborhood to save money for their home purchase. The primary motivations behind their home searches include homeownership, increased space, and better access to the outdoors. The proximity to family plays a significant role, with over 25% of respondents considering it in their home search.
Furthermore, family support extends beyond home location preferences. Approximately 50% of respondents are motivated to move closer to family for childcare assistance, with 44% seeking help with their own children. Siblings and parents, too, are buying or considering buying homes in proximity to family members.
The survey indicates that 83% of respondents are open to the idea of co-buying a home with family or friends. For many, this approach enables resource pooling, leading to the acquisition of homes in better areas or with more modern features and increased space.
Although the national median listing price has decreased year-over-year, elevated mortgage rates have pushed the cost of homeownership more than 20% higher than in the previous year. As a result, homebuyers are exploring creative solutions to enter the market, including turning to family for support. The shortage of homes available for sale remains a concern, sustaining high prices as demand continues to outpace supply. However, prospective buyers may find relief in the expanding new construction sector, with builders increasing production to meet the surging demand. As the market continues to evolve, the enduring importance of family in the homebuying process remains a noteworthy trend.
Rent Check - September 2023:
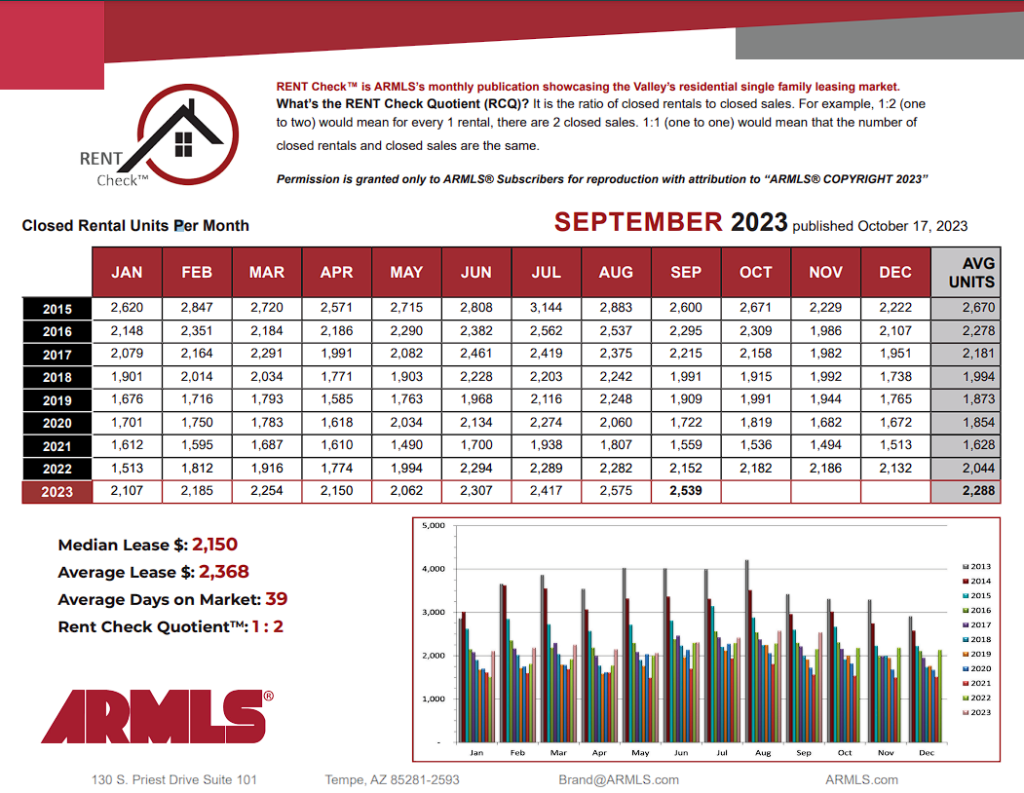
“ARMLS® COPYRIGHT 2023”
RENT Check™ is ARMLS’s monthly publication showcasing the Valley’s residential single family leasing market.
What’s the RENT Check Quotient (RCQ)? It is the ratio of closed rentals to closed sales. For example, 1:2 (one
to two) would mean for every 1 rental, there are 2 closed sales. 1:1 (one to one) would mean that the number of
closed rentals and closed sales are the same. This month's Rent Check has the Median Lease Price at $2150 with the Average lease at $2368.
Average days on market are 39.
The Rent Check Quotient® is 1 : 2.
Click HERE to see what's in the MLS for Rentals.
Ready to see if you're ready to buy, you might be, reach out to one of the AWESOME LENDERS I work with who can work with you through programs you qualify for, getting ready to buy, down payment assistance, etc. I suggest Michael or Brogan .
[market_stats title="Valley of the Sun Sold Listings" type="inventory" display="SoldListings" property_type="A"]
[market_stats title="Valley of the Sun Inventory" type="inventory" display="ActiveListings,NewListings" property_type="A"]
[market_stats title="Valley of the Sun New Listings" type="inventory" display="NewListings" property_type="A"]
[market_stats title="Valley of the Sun Pending Listings" type="inventory" display="PendedListings" property_type="A"]
[market_stats title="Valley of the Sun Absorption Rate" type="absorption" property_type="A"]
[market_stats title="Valley of the Sun Sale to Original List Price Ratio" type="ratio" display="SaleToOriginalListPriceRatio" property_type="A"]
[market_stats title="Valley of the Sun Average Days on Market" type="dom" display="AverageCdom" property_type="A"]
[market_stats title="Valley of the Sun New Listings Volume" type="volume" display="NewListVolume" property_type="A"]
For today, Friday, October 20, 2023, the current average interest rate for a 30-year fixed mortgage is 8.01%, up 12 basis points from a week ago. If you're in the market for a mortgage refinance, the average 30-year fixed refinance interest rate is 8.04%, falling 1 basis point since the same time last week. Meanwhile, the national 15-year refinance interest rate is 7.31%, up 12 basis points from a week ago.
New Listings:
[idx_slideshow title="New to the Market" link="default" horizontal="5" vertical="1" auto_rotate="5000" source="location" display="new" sort="recently_changed" destination="local" send_to="photo"]
Upcoming Open Houses:
Don't forget to bring me!
[idx_slideshow title="Open Houses this Weekend" link="default" horizontal="5" vertical="1" auto_rotate="5000" source="location" display="open_houses" sort="recently_changed" destination="local" days="3" send_to="photo"]
Recent Price Changes:
[idx_slideshow title="Recent Price Changes" link="1j1974m9yayv" horizontal="5" vertical="1" auto_rotate="5000" source="location" display="all" sort="recently_changed" destination="local" send_to="photo"]
Featured Listings:
[idx_slideshow title="Featured Listings" link="1r3sw5k5196o" horizontal="5" vertical="1" auto_rotate="5000" source="location" display="all" sort="recently_changed" destination="local" send_to="photo"]
ADOT's Weekend Freeway Travel Advisory (Oct. 20-23) - Phoenix Area-Plan for closures of I-10 near Broadway Curve, US 60 in East Valley
PHOENIX – Improvement projects will require closures or lane restrictions along some Phoenix-area freeways this weekend (Oct. 20-23), according to the Arizona Department of Transportation. Drivers should allow extra travel time and plan detour routes if necessary while the following weekend restrictions are in place:
- Eastbound Interstate 10 closed between US 60 (Superstition Freeway) and Loop 202 (Santan/South Mountain freeways) from 11 p.m. Friday to 4 a.m. Monday (Oct. 23) for the I-10 Broadway Curve Improvement Project. Westbound US 60 ramp to eastbound I-10 closed. Both HOV ramps between I-10 and US 60 closed. Eastbound I-10 on-ramp at Broadway Road closed.
- Detours: Eastbound I-10 drivers can consider using eastbound Loop 202 (Red Mountain Freeway) starting near SR 51 to reach southbound Loop 101 or using eastbound US 60 to southbound Loop 101 and westbound Loop 202 (Santan Freeway) in Chandler to reach I-10 beyond closure. Drivers in the West Valley also can use southbound/eastbound Loop 202 (South Mountain Freeway) to avoid the eastbound I-10 closure.
- Westbound I-10 narrowed to two lanes between Baseline Road and US 60 from 10 p.m. Friday to 4 a.m. Monday (Oct. 23) for construction. Eastbound US 60 off- and on-ramps at Mill Avenue also closed. Allow extra travel time and consider alternate routes. Please use caution and be prepared to slow down and merge safely when approaching all work zones.
- Note: Guadalupe Road closed in both directions between Pointe Parkway and Calle Saguaro from 8 p.m. Friday to 4 a.m. Monday (Oct. 23). Consider using Elliot Road.
- Eastbound US 60 (Superstition Freeway) closed at Greenfield Road from 9 p.m. Friday to 5 a.m. Monday (Oct. 23) for bridge work. Eastbound US 60 on-ramps at Val Vista Drive, Gilbert Road and Stapley Drive also closed. Please allow extra travel time.
- Detours: Consider exiting ahead of the closure and using eastbound Baseline Road, Southern Avenue or Broadway Road to travel beyond the closure. The eastbound US 60 on-ramp at Greenfield Road will be open, but plan for heavier traffic in the area.
- Southbound Loop 101 (Agua Fria Freeway) narrowed to two lanes overnight between Glendale Avenue and Cardinals Way from 9 p.m. to 5 a.m. Sunday through Wednesday nights (Oct. 22-25) for pavement repairs. Southbound Loop 101 on-ramps at Glendale and Maryland avenues closed at times.
- Detour: Consider using southbound 91st or 99th avenues to Cardinals Way when ramps are closed.
Schedules are subject to change due to inclement weather or other factors. ADOT plans and constructs new freeways, additional lanes and other improvements in the Phoenix area as part of the Regional Transportation Plan for the Maricopa County region. Most projects are funded in part by Proposition 400, a dedicated sales tax approved by Maricopa County voters in 2004.
Real-time highway conditions are available on ADOT’s Arizona Traveler Information site at az511.gov and by calling 511. Information about highway conditions also is available through ADOT’s Twitter feed, @ArizonaDOT.
National Real Estate News
Real Estate News in Brief
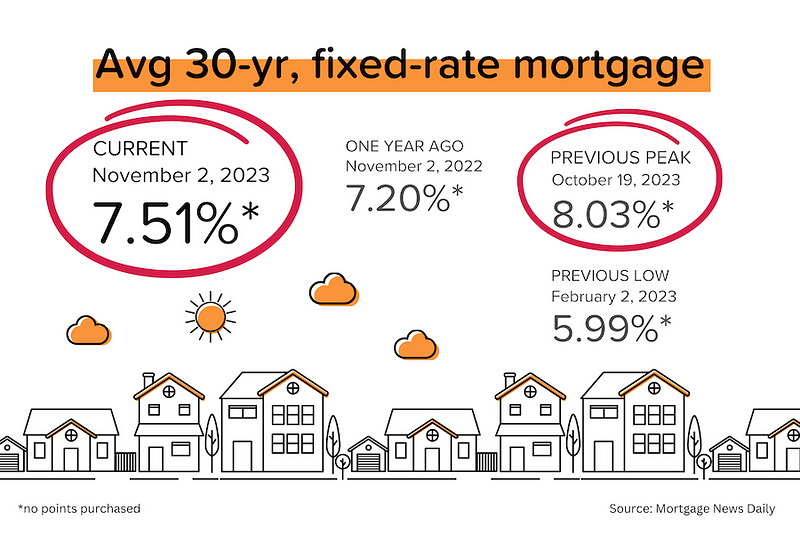
Responding to very strong retail sales figures, the bond market took another dive, and average 30-year mortgage rates consequently moved above 8%. The slowdown in transaction volumes will likely continue, but there are signs that home prices are beginning to drift lower.
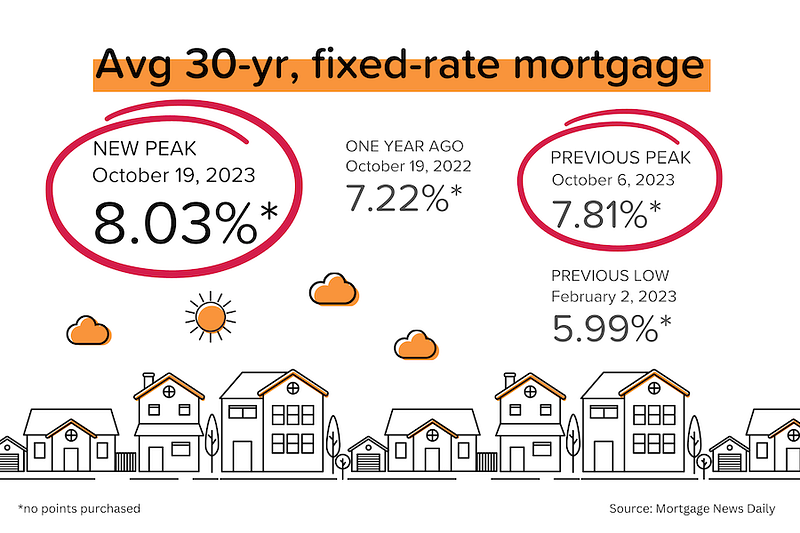
8.03%. That was the average rate for 30-year, fixed rate mortgages on October 19, according to Mortgage News Daily. As a reminder, on February 2, 2023, the average rate was 5.99%. What drove the latest spike? Read on.
Shop, shop, until we drop? September retail sales rose an incredible 0.7% MoM, trouncing expectations of a 0.3% MoM rise. The Fed wants lower inflation and slower growth. This looks like the opposite, stoking bond market fears of ‘higher for longer’ interest rates. The yield on the 10-year US treasury recently closed at 4.97%, the highest level since mid-2007. [Census Bureau]
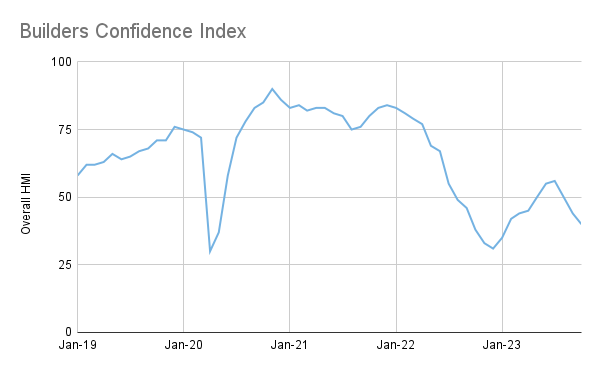
Builder confidence got hammered. The National Association of Homebuilders’ confidence index dropped 4 points to 40 in October 2023 (anything <50 = bearish). That’s the lowest figure since January 2023. “Builders have reported lower levels of buyer traffic, as some buyers, particularly younger ones, are priced out of the market by higher rates.” [NAHB]
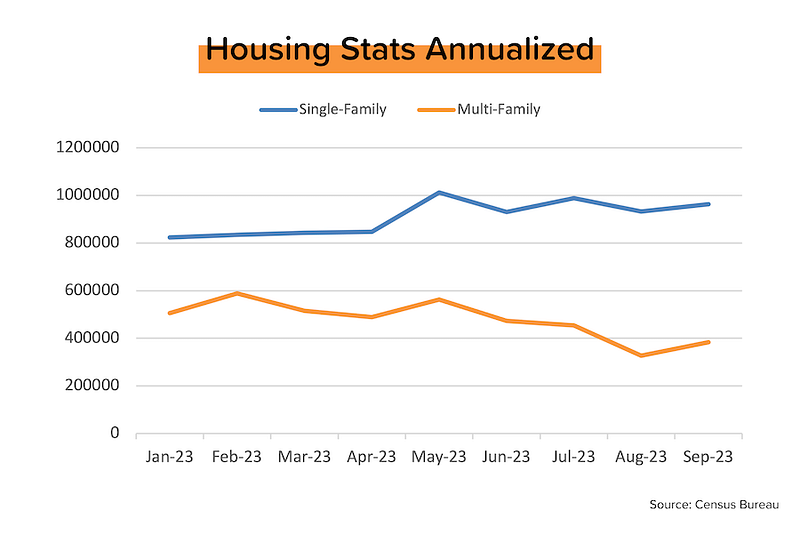
A mixed bag from housing starts & permits. New housing permits fell 4% MoM to an annualized rate of 1.47 million units. But within that, new permits for single-family homes rose 2% MoM. In fact, SFH permits have risen every month this year and now represent two-thirds of the total. [Census Bureau]
The boom in new multifamily construction (buildings with >5 units) in 2021–2022 is drawing to a close. While there are nearly 1 million MF units (on an annualized basis) under construction, permits for new MF units have plunged since the beginning of the year. [Census Bureau]
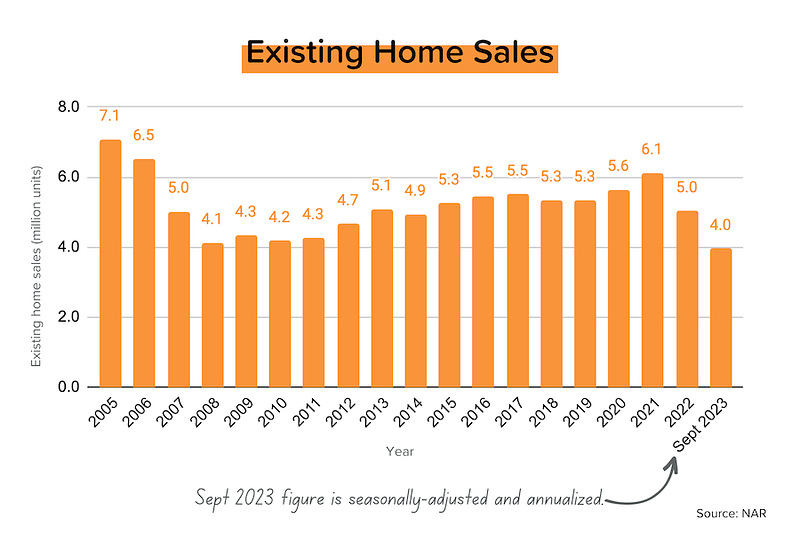
In the threes. Existing home sales for September dropped 2% MoM (and 15% YoY) to an annualized pace of 3.96 million units sold. That’s the lowest figure in 13 years, but I actually thought it would be much worse considering the movement in mortgage rates. Median home prices also dropped into the threes, in this case $394,300 (-3% MoM). [NAR]
Realtors are losing confidence, but homes are still selling quickly. Only 8% of Realtors thought that buyer traffic would improve in the coming 3 months. But for the homes that sold in September, 69% were on the market less than a month, and they saw an average 2.6 offers. [NAR]
Powell in NYC. Did Fed Chairman Jerome Powell hear the pleas of the NAR, NAHB, and MBA, and explicitly call time on interest rate hikes at his Economic Club of New York speech? Of course he did not. Instead, the much-anticipated speech turned into a non-event.
A Seasonal Reminder
’Tis the season when inventory levels rise and prices fall, but people often forget that. It’s a supply and demand thing, driven by weather and school start dates. I mean, who wants to move their family in January? Yank the kids out of school mid-year and get frostbite while loading the U-haul? Also, in winter some sellers may delist their home or cut prices to move ‘stale’ inventory.
Of course, this normal seasonal pattern can get disrupted, which is what happened during the pandemic. But the underlying seasonality is still there. It’s just hidden.
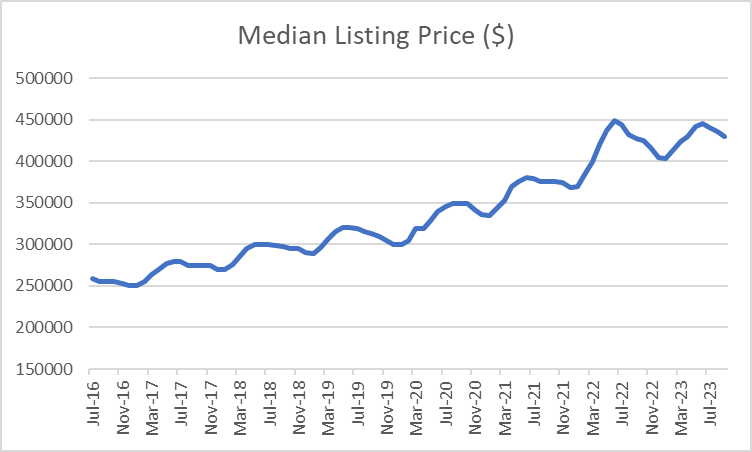
First, let’s look at the chart of median listing prices below. It’s from Realtor.com’s residential real estate database. Here’s what’s important to know:
- Listing prices trend strongly upward, but exhibit clear seasonality
- Listing prices bottom in January (occasionally December)
- Listing prices tend to peak in June or July (occasionally August)
- The average tough-to-peak rise is 12% (if you exclude 2022, which was +22%)
- The average peak-to-trough decline is 4% (if you exclude 2022, which was -10%)
- The median list price has risen 66% since July 2016
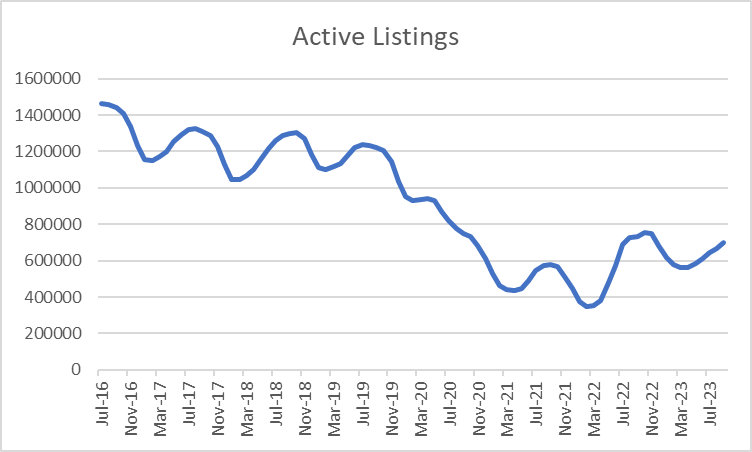
Next, let’s look at active inventory. This is also from Realtor.com and excludes listings that have already gone pending. As you can see in the graph below, the normal seasonality got completely swamped by the pandemic boom in demand. In 2020, the typical rebound in inventory basically didn’t happen at all. Here’s what you need to know:
- Active inventory has been trending lower over time, and exhibits clear seasonality
- Active inventory levels tend to trough in January or February (which is also when prices start to rise?—?see the connection?)
- Active inventory levels tend to peak sometime between July-September, at least until the pandemic threw everything off.
- The average trough-to-peak increase in active inventory pre-pandemic was 18%.
- The average peak-to-trough decline in active inventory pre-pandemic was 21%
- Between the peak of July 2019 and the trough of February 2022, active inventory fell 72%.
- Active inventory has dropped by 52% between July 2016 and today.
I’ll be watching this inventory figure very closely. If it keeps rising in October and November, that will be because there is a ‘buyer’s strike,’ and prices could begin falling again.
Realtor’s Confidence Index for September
I love this report because it goes beyond just sales and inventory numbers. The results of the September survey were consistent with low (and slowing) transaction activity, and with relatively high (but easing) competitive intensity for the limited supply.
- Only 8% of respondents said that they expect buyer activity to pick up over the next 3 months. But that’s not terribly surprising given normal seasonality and current mortgage rates.
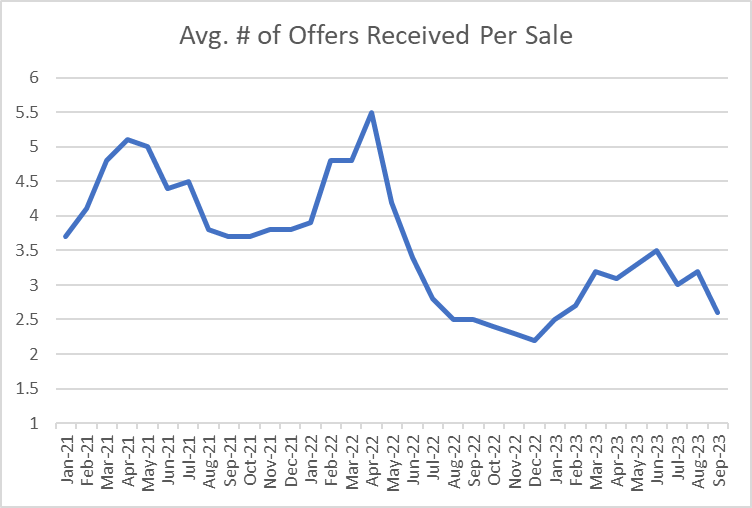
- The number of offers per home sold in September dropped to 2.6 (from 3.2 in August). This means that on average, there were 1.6 unsuccessful offers for each home sold (because 1 offer actually got it).
- 26% of the homes sold in September transacted above their original list price (down from 31% in August and 35% in July). In April 2022, that figure was 61%! Ahhh! The good old days!
- 69% of the homes sold in September were on the market less than a month before they found a buyer (down from 72% in August). In April 2022, that figure was 88%.
- 29% of the homes sold in September were all-cash, equalling the January 2023 high.
- 27% of buyers waived the inspection contingency (up from 23% in August). In June 2022, that peaked at 30%. You wouldn’t do that unless you were afraid of losing out to someone else.
Mortgage Market
At the end of August, average 30-yr mortgage rates plunged from 7.50% to 7.08%, and hope was building that a return to 6% rates was in sight. Since then, the 10-year US treasury has moved sharply closer to 5% and mortgage rates have jumped above 8%. And while more Fed members are suggesting that the Fed has already done enough, Mr. Powell hasn’t even come close to declaring “mission accomplished.”
Interestingly, the last time the yield on the 10-year UST was this high (2007), mortgage rates were 100 basis points (1%) lower. What’s different this time? We’ll never know for sure, but it seems to reflect: 1) greater uncertainty with regards to the Fed’s policy rate direction, and 2) the steeply inverted yield curve.
The futures market is currently pricing in a tiny 4% chance of a rate hike on November 1, but is putting a 37% probability on a +25 bps hike at the subsequent FOMC meeting on December 13.
They Said It
“The housing affordability crisis can only be solved by adding additional attainable, affordable supply. Boosting housing production would help reduce the shelter inflation component that was responsible for more than half of the overall Consumer Price Index increase in September and aid the Fed’s mission to bring inflation back down to 2%. However, uncertainty regarding monetary policy is contributing to affordability challenges in the market.”?—?Robert Dietz, NAHB’s Chief Economist
“As has been the case throughout this year, limited inventory and low housing affordability continue to hamper home sales. The Federal Reserve simply cannot keep raising interest rates in light of softening inflation and weakening job gains.”?—?Lawrence Yu, NAR’s Chief Economist
My Website always has a list of what's upcoming. Go here and maybe I'll see you out there!
DeDe's Social Media:


What's Going on with DeDe?
Darci is sporting her new harness while guarding the window!

Had a GREAT time with one of my guru friends at an Ads extravaganza and learned lots how to market my listings and got an advance copy of her new book!


Finally got to be in the room with a wonderful Mentor and got a copy of his new book, which the dogs loved!


Got my beauty on getting a wonderful Peel from the Magical D'Lisa Shayn at Salon D'shayn, so I'll be molting for the next week!


Got the appraisal back at a wonderful Surprise home my clients are buying.
That's all for the Birthday edition of the newsletter! Know I am always here for any questions you have about Buying, Selling, or Investing in Residential Real Estate! HomeOwnership too! Vendors and Tradespeople too! Don't hesitate to Reach out
See you next Week!
DeDe